A VOLUME-INTEGRAL CODE FOR ELECTROMAGNETIC NONDESTRUCTIVE
EVALUATION
R. Kim Murphy, Harold A. Sabbagh, Anthony Chan, and Elias H. Sabbagh
Sabbagh Associates, Inc., 4635 Morningside Drive, Bloomington,IN 47408, USA
Introduction
In 1 we developed a volume-integral eddy-current model that
is designed to solve problems in nondestructive evaluation. The integral
equations are discretized on a regular grid, which means that the resulting
matrices are either Toeplitz, which implies a convolutional structure,
or Hankel, which implies a correlational structure. In either case, large
problems can be solved using conjugate-gradients, with the matrix-vector
multiplies computed using the three-dimensional fast Fourier transform.
The default scheme for solving the equations is the LU-decomposition.
The model is now implemented in the computer code VIC-3D® and in
this paper we present some results computed with it. Our first results
are aimed at validating the model and code by comparing data from two benchmark
experiments, and in the second part of the paper we give model calculations
that are typical of the nuclear power industry.
Two Validation Problems
The first problem, which is illustrated in Figure 1, consists of a coil
that is scanned over a flaw in a conducting workpiece 3. The
flaw is a long, thin, empty slot, and the workpiece is a half-space of
aluminum. The excitation frequency is 900 Hz, and the objective is to compute
the change in impedance seen by the probe coil, as the coil is scanned
over the flaw, and compare with the measured values listed in 2. The
results for the real and imaginary parts of the impedance-change are shown
in Figure 2
|
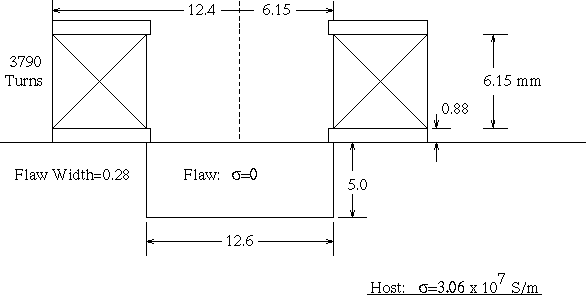 |
| Figure 1. Validation Problem No. 1, consisting of a coil being scanned over a long, narrow, empty slot in a half-space of aluminum. All dimensions are in millimeters. |
|
|
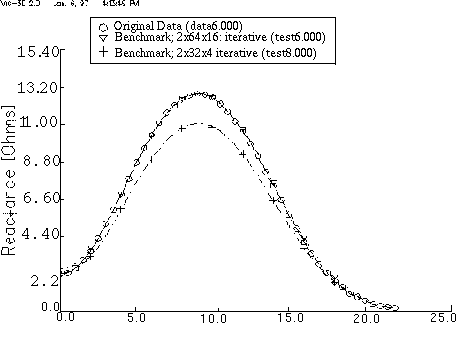 |
| Figure 2. Comparison of measured and computed changes-of-impedances for Validation Problem No.1. The del's label results for a mesh of 2 x 64 x 16 (width times length times depth) cells, and the +'s label results for a mesh of 2 x 32 x 4 cells. The original data, which are the experimental benchmark results, are labeled with the 0's. |
|
|
The conjugate gradient iterative method was used to compute the results
shown in Figure 2; in the following figure we show the reduction of the
normalized residual as the algorithm converges.
|
              PERCENT ERROR in RESIDUAL
          0       25      50      75     100
          |       |       |       |       |
Iteration --------------------------------              dR [Ohm]   dX [Ohm]
    0     |********************************     100.00   .0000E+00  .0000E+00
    5     |*****************************      91.28     -.2454E+00  .4074E+00
   10     |**************************      82.58        -.7444E+00  .1189E+01
   15     |*************************      76.78         -.1048E+01  .1950E+01
   20     |***********************      72.85           -.1192E+01  .2689E+01
   25     |*********************      64.93             -.1341E+01  .4485E+01
   30     |*****************      52.23                 -.1469E+01  .7168E+01
   35     |***********      35.40                       -.1541E+01  .9996E+01
   40     |*******      22.34                           -.1563E+01  .1149E+02
   45     |******      17.31                            -.1567E+01  .1190E+02
   50     |*****      14.82                             -.1569E+01  .1208E+02
   55     |****      11.77                              -.1573E+01  .1225E+02
   60     |***       9.76                               -.1578E+01  .1235E+02
   65     |**       7.56                                -.1586E+01  .1244E+02
   70     |**       5.09                                -.1594E+01  .1251E+02
   75     |*       3.72                                 -.1597E+01  .1253E+02
   80     |*       2.81                                 -.1597E+01  .1254E+02
   85     |*       2.20                                 -.1593E+01  .1255E+02
   90     |       1.43                                  -.1585E+01  .1256E+02
   95     |        .86                                  -.1580E+01  .1256E+02
  100     |        .49                                  -.1578E+01  .1256E+02
  105     |        .30                                  -.1577E+01  .1256E+02
  110     |        .19                                  -.1577E+01  .1256E+02
  115     |        .11                                  -.1577E+01  .1256E+02
  120     |        .05                                  -.1577E+01  .1256E+02
|Z| converged
|
The result is for the fine mesh (2 x 64 x 16 cells), with the probe
located at 10 mm. There are 4960 unknowns in this problem.
In the second validation test, we compare model predictions with measurements
performed at the Oak Ridge National Laboratory and communicated to us by
Dr. C. V. Dodd. The test that we have modeled is shown in Figure 3. It
consists of a bobbin coil within an aluminum tube 7S/m), which has four through-wall holes symmetrically
placed around the circumference of the tube. The coil is excited at 500
Hz. In modeling this test, we compute the change in impedance due to one
hole, and divide the measured impedance-changes by four.
|
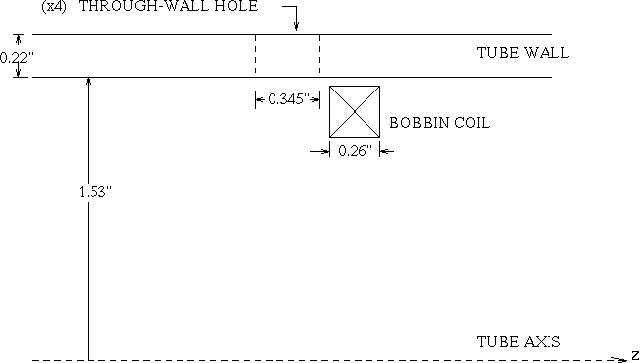 |
| Figure 3. Validation Problem No. 2, consisting of a bobbin coil within an aluminum tube with a circular hole. |
|
|
The magnitude and phase of the impedance-change due to the holes is shown
in Figure 4.
The differences between measurement and model calculation may be due
to the fact that in computing the matrix elements for the scattering from
the flaw, we treat the tube as being a flat workpiece. This allows us to
use a Green's function for a layered, plane-parallel host, of the type
that was used in the first test problem. Another possibility for the discrepancy
is that the signal from four holes is not simply four times the signal
from a single hole.
|
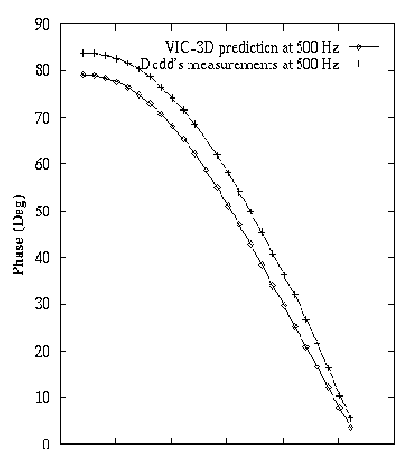 |
| Figure 4. Comparison of measured and computed changes-of-impedances for Validation Problem No.2. |
|
|
Axisymmetric Problems in Nuclear Power.
In 2 we specialized the general three-dimensional formulation
of 1to axisymmetric problems, such as those typically found
in steam generator tubing for the nuclear power industry. These problems,
which are defined by means of a few parameters, are solved in a module
called Tube Support Plate. Figure 5 illustrates the manner in which the
parameters may vary in order to define problems ranging in complexity from
a simple tube support plate with a magnetite gap to a tube with a non-uniform
radius, support plate, magnetite gap, and sludge region. All axisymmetric
problems are solved using the LU-decomposition, because the resulting equations
lack the Toeplitz or Hankel structure in the radial direction, which negates
the advantage of using the conjugate-gradient/FFT algorithm.
|
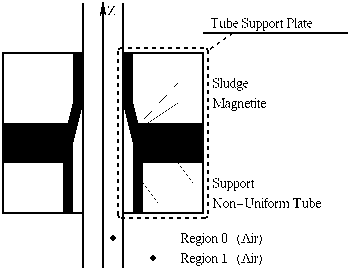 |
| Figure 5. Examples of Axi-symmetric Regions Modeled with the Tube Support Plate -- 1. Tube support plate with magnetite gap; 2. Tube with non-uniform radius; 3. Tube with non-uniform radius and support plate; 4. Tube with non-uniform radius, support plate, magnetite gap, and sludge region. |
|
|
A Model Calculation.
Figure 6 illustrates a common situation in the nuclear power industry, in which
an axial flaw exists on the outer surface of a tube, and is centered under a ferromagnetic
tube support that may even contain a layer of magnetite. The detector is a standard
differential bobbin probe. The challenge is to detect and classify flaws,
which produce a relatively small signal, in the presence of the large signal
presented by the tube support or the magnetite layer. The results shown
in Figures 7 through 9 are for a model calculation, only. We do not have experimental
data to support this calculation.
|
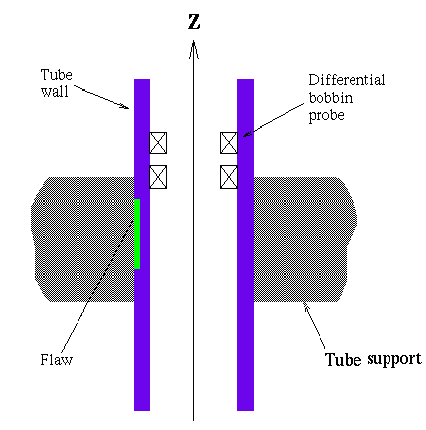 |
| Figure 6. An external axial flaw, centered under a ferromagnetic tube support |
|
|
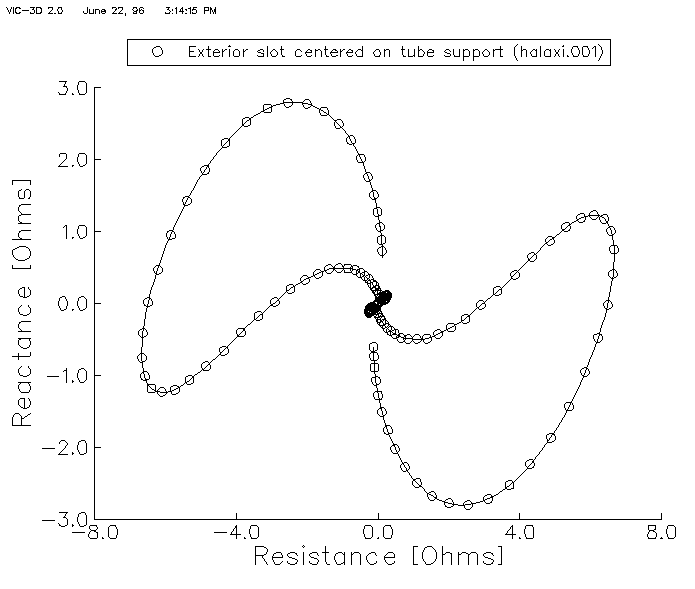 |
| Figure 7. The response of the differential bobbin probe to the flaw and tube support is shown in the upper right. The signal from the edges of the tube support dwarf the flaw signal, which is buried in the middle of the curve. |
|
|
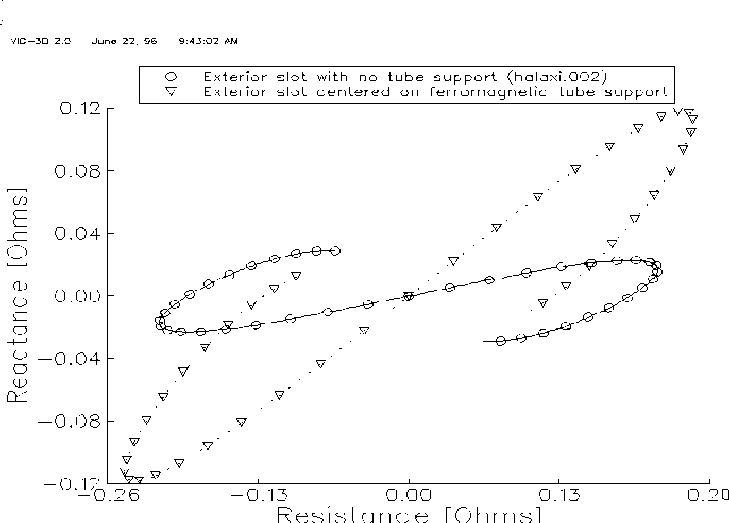 |
| Figure 8. The flaw signal alone is shown; the tube support signal has been subtracted ('balanced out'). Also shown is the flaw signal from a tube with no support. |
|
|
 |
| Figure 9. The effect of a large magnetite layer on the curve of Figure 7.. |
|
|
Acknowledgement.
The development of the axisymmetric tube support plate model was supported
in part by the Electric Power Research Institute (EPRI), Palo Alto, CA.
- R. Kim Murphy, Harold A. Sabbagh, Jeff C. Treece, and Lai Wan Woo,
"A Volume-Integral Code for Electromagnetic Nondestructive Evaluation,"
Conference Proceedings, 11th Annual Review of Progress in Applied Computational
Electromagnetics, March 1995, pp. 109-116.
- H. A. Sabbagh, R. K. Murphy, J. C. Treece, and L. W. Woo, "Application
of Volume-Integral Models to Steam Generator Tubing," in Review of
Progress in Quantitative Nondestructive Evaluation, Vol. 14, D. O.
Thompson and D. E. Chimenti, eds., Plenum Press, New York, 1995, pp. 283-289.
- S. Burke, "A Benchmark Problem for Computation of Delta-Z in Eddy-Current
NDE," Journal of Nondestructive Evaluation, Vol. 7, Nos. 1/2, 1988, pp.
35-41.
|
|
|